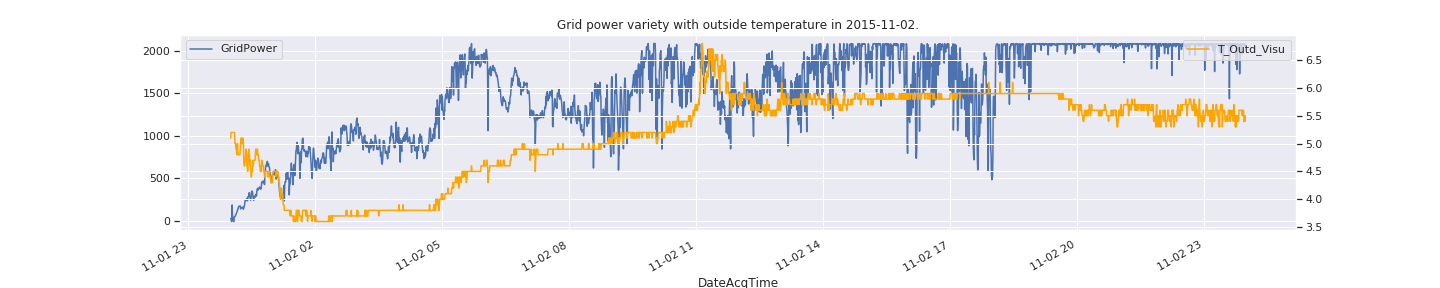
设置第二条 y 轴,然后将 ax 传入 df.plot
ax1 = df.plot(x='x1', y='y1', figsize=(20,4))
ax2 = ax1.twinx()
df.plot(x='x1', y='y2', figsize=(20,4), color='orange', ax=ax2)
```
欢迎来到这里!
我们正在构建一个小众社区,大家在这里相互信任,以平等 • 自由 • 奔放的价值观进行分享交流。最终,希望大家能够找到与自己志同道合的伙伴,共同成长。
注册 关于